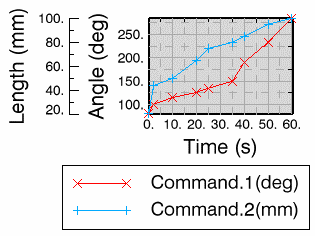
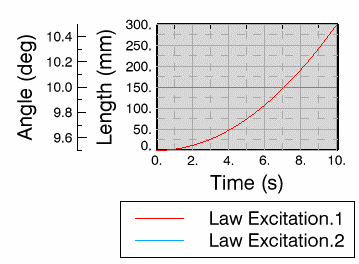
The X-Y plot opens in a new window, and a curve is created for each
excitation you selected in the scenario.
For excitations based on a design table or for recorded excitations, the
curve displays the points that correspond to the values defined in the
table.

For formula-based excitations, the plot displays
a smoothed curve that corresponds to the mathematic definition given by the
formula.
