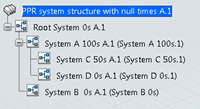
Once cycle times are defined for systems, they are displayed in
different panels and Gantt charts.
Workload Balancing Panel
In the
Workload Balancing panel, cycle time is
displayed by a red line at the top of the columns and in the table. Cycle time
is displayed only for leaf systems. Maximum cycle time value among the leaf
systems is displayed at the left of the vertical line axis.

Process Gantt Chart
In the Process Gantt Chart, cycle time is displayed by two vertical
green bars called cycle bars. They appear if the system is a leaf system and has
operations.
The cycle bars stretch from the top of a system row to the bottom
of its last operation row.
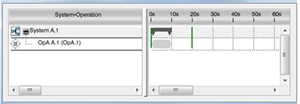
If the leaf system has a zero cycle time, only the first bar is
displayed.
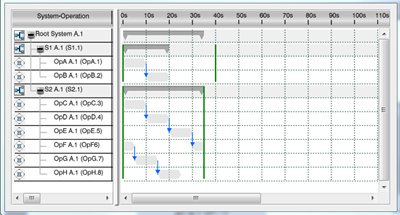
When operations exceed the cycle time, in system view and product
flow on cycle time view, they are cut and displayed underneath. For example, in
the image below, OpF to OpH exceed the cycle time.
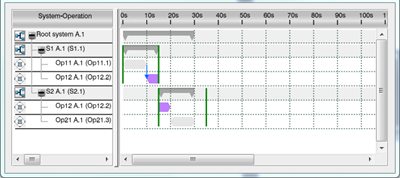
In the case of drifting operations, the drifted operations are
colored violet.
Resource Gantt Chart
In the
Resource Utilization Gantt Chart cycle time is
displayed by two vertical green cycle bars. They appear for leaf organizational
resources and their working resource children. The cycle time is the one
inherited from the organizational resource that has a scope with a system. This
resource has the same cycle time as the system.
For example, in the case below:
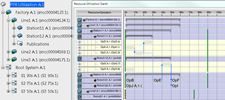
The organizational resource Line1 has a scope with the system S1
that has a cycle time of 90 seconds. Line1 has organizational resources as
children: Station11 and Station12. Station11 and 12 inherit the cycle time of
S1. They do not have child organizational resources, so the cycle time is
displayed with green bars. The working resources under Station11 and 12 also
inherit the same cycle time.
