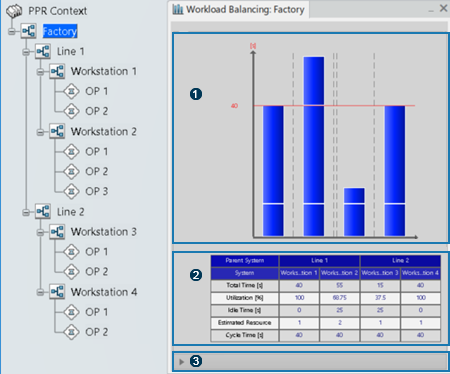
Workload Balancing Panel
The Workload Balancing panel provides time and resource information about a system and lets you drag operations between child systems.
To open the panel, select a system and click
Workload Balancing
![]() .
.
Hover over parts of the image to see the name for that section of the panel. Click any blue-bordered area for more information.

Tips:
|
 Bar Chart
The bar chart comprises the following elements:
| Columns | A column represents a
leaf
system in the selected system.
Systems are placed from left to right in the order of the product flow. For example, if the product flow order is S1 > S2 > S3, then S1 will be the leftmost column and S3 the rightmost one. Note:
Only General and
Transformation systems are displayed.
|
|
| Blocks | A block represents an operation inside a
leaf system.
A context menu is available on block to access Properties or to manage time analysis. You can customize the block color in .
|
|
| Red horizontal lines | A line represents the cycle time of a
leaf system.
The maximum cycle time value among the leaf systems appears to left of the vertical axis line. |
You can rearrange operations by dragging them:
- Between columns
- Between the bar chart and the tree
- Between two bar chart views
This automatically updates the workload balancing and the position of the operations in the tree. Precedence constraints are automatically reconnected if possible.
For example, you can drag operations from the tree of a global workplan to the bar chart of a local line-balancing system, or between two separate bar charts for two separate factories.
 System Information Table
The table under the bar chart provides the following information for each system:
| Total Time | The sum of the operation times. |
| Utilization | Total Time * 100 / (Estimated Resources * Cycle Time) |
| Idle Time | Estimated Resources * Cycle time – Total Time |
| Estimated resources | (Total Time / Cycle Time) + 1
This represents the minimum number of resources required to realize the operations to respect the time cycle. |
| Cycle Time | The cycle time of the root system. |
- Product Configuration Display: Displays
a panel that lets you:
- Activate the product configuration display. You can then drag-and-drop operations across systems that have the same configuration. If the effectivities of the source and target systems are different, the drag-and-drop is impossible.
- Display the product configuration synthesis. This option displays the system time (maximum, minimum and average) for all configurations, in a single column. You can display configurations that have no quantity specified (Manual Selection) or one of the production demands from the list. A tooltip and colors indicate the minimum, maximum and average system time.
- Small Duration Mode :
Shows operations with no defined duration.
You can define the width and color of the blocks depends on the Small Duration options in .
- Actual Duration Mode: Closes Small Duration Mode and reverts back to default mode.
- Export to XML: Exports the system
information table as in XML file.
For more information, see Exporting Workload Balancing Information to an XML File.
 Balancing Report
To display the report, expand the section beneath the table.
The report contains the following information:
| Number of Systems | The number of systems in the workload balance table. |
| Number of Models | The number of models in the workload
balance table.
If the number of models is greater than one, or if any configuration is activated, then the rest of the fields in the expanded section will be non-applicable and displayed as Not Applicable. |
| Number of Configurations | The number of configurations in the
workload balance table.
If no configuration is activated, then the total number of available configurations is displayed. If any configuration is activated, then the total number of activated configurations is displayed. |
| Number of Estimated Resources | The number of estimated resources in the workload balance table. |
| Number of Operations | The number of operations in the workload balance table. |
| Total Time [s] | The sum of all the total time of individual systems shown in the table. |
| Total Utilization [%] | The percentage of total time divided by the sum of cycle times of individual systems. |

