View System Utilization and Product Inventory Charts
You can visualize the system utilization and product inventory charts along with the dynamic updates during simulation.
- Select Display Systems Utilization and Display Products Inventory check box in the Monitoring Options tab
 of Production System Simulation Options panel.The Systems Utilization and Products Inventory tab
 appears in the System Performance Monitor dialog box.
 - Select a system and click Play
 to simulate.The System Performance Monitor
 dialog box appears.
You can click System Performance Monitor
after or during simulation. - Click System Utilization
 tab in System Performance Monitor dialog box.
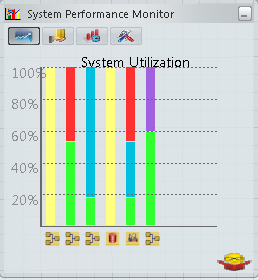 Note: System utilization is available only for General, Transfer, and Buffer systems. This data is represented using vertical bar chart, with unique color for each system.
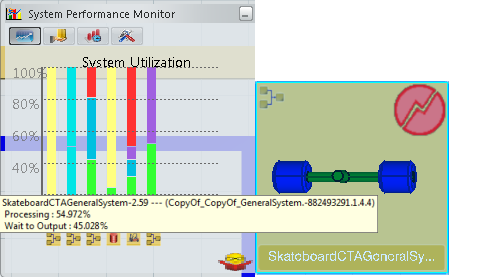
 - Place the pointer over the system utilization bar chart.The name and utilization value (of the system) displays as a tool tip. Select any bar on the bar chart, the (selected) system highlights in the Live System Editor.
- Click Product Inventory
 tab.The System Performance Monitor dialog box appears with Overall Inventory tab and System Specific Inventory tab.
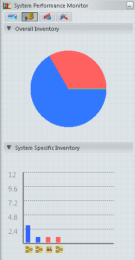
The tab displays the products that are in use during simulation. For more information on Product Inventory tab, see Product Inventory State and Statistics
- Click
 to view the HTML report.


 .
. in
in  tabs.
tabs. are available for multi-run simulation.


