Mixed-mode failure of a notched unreinforced concrete
beam
This example illustrates the use of the cracking constitutive
model for the analysis of an unreinforced notched concrete beam subject to
loading that causes mixed-mode cracking.
This problem was chosen because it has
been studied extensively both experimentally by Arrea and Ingraffea (1982) and
analytically by Rots et al. (1984, 1985, 1987, 1989, 1991, 1992), de Borst
(1986, 1987), and Meyer et al. (1994), among others. The behavior in this
problem is a combination of Mode I and Mode II
cracking. It, therefore, provides verification of the model for general
mixed-mode loading. We also have the advantage that this beam experiment has
been repeated by a number of different researchers, and there is good material
information about important parameters such as the Mode I fracture energy,
.
We investigate the sensitivity of the numerical results to the finite element
discretization as well as the choice of cracking material properties.
The notched beam is shown in
Figure 1.
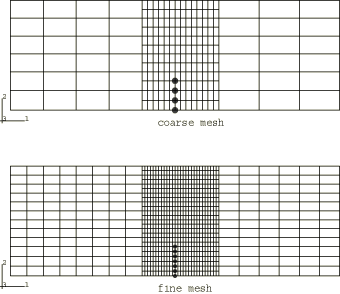
Figure 2
shows the two meshes used for this problem: a coarse mesh of 210 elements, and
a fine mesh of 840 elements. The beam is assumed to be in a state of plane
stress, so CPS4R elements are used. The basic concrete material properties used in
the beam are given in
Table 1.
The fracture energy value
does not completely define the evolution of the postcracking stress; this is
the subject of one of the studies carried out in this example. The shear
retention properties, given later, are the subject of the other material
property study.
Loading and solution control
Since
Abaqus/Explicit
is a dynamic analysis program, and in this case we are interested in static
solutions, care must be taken that the beam is loaded slowly enough to
eliminate any significant inertia effects. For problems involving brittle
failure, this is especially important since the sudden drops in load-carrying
capacity that normally accompany brittle behavior generally lead to increases
in the kinetic energy content of the response.
The beam is loaded by applying a velocity that increases linearly from zero
to 0.75 mm/second over a period of 0.38 seconds. The velocity is applied at
point C and transmitted to the notched beam through the rigid beam
AB. The beam itself is not modeled since its
kinematic motion can easily be modeled using an equation constraint. The load
transmitted at points D and B is distributed over a 30 mm length to avoid
hourglassing of the elements in the vicinity of these points where the highest
loads are transmitted. The velocity chosen ensures that a quasi-static solution
is obtained. The kinetic energy in the beam is small until the crack has
propagated across the entire depth of the beam. Nevertheless, oscillations in
the load-displacement response caused by inertia effects are still visible,
mainly after the concrete has cracked significantly.
Results and discussion
Results are described below for each analysis variation.
Mesh refinement study
Two finite element meshes are used to show the influence of mesh refinement
on the load-displacement response of the concrete beam. The value of the Mode I
fracture energy, ,
can be specified directly for brittle cracking properties to define tension
softening behavior that gives approximately mesh insensitive results. However,
this is not done here for two reasons: first, this specification restricts the
postcracking normal stress evolution to a linear variation, and we want to be
more flexible than that in some of our studies; second, by specifying the
postfailure stress-strain relationship directly, we show how
Abaqus/Explicit
converts fracture energy data into cracking stress versus cracking strain data.
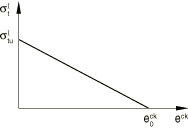
If we specify the tension softening behavior in terms of stress versus
cracking strain and we assume a linear dependence of stress on cracking strain,
as shown in
Figure 3,
the cracking strain at which the stress reaches a zero value,
,
can be calculated as
/ (),
where
is the cracking failure stress and h is a characteristic
element length. This characteristic length represents the size of the element
that cracks and has values of 15 and 7.5 mm for the coarse and fine meshes,
respectively. This method of calculating the cracking strain at which the
stress reaches a zero value provides material data that will give approximately
mesh insensitive results and is essentially what
Abaqus/Explicit
does when the parameter TYPE=GFI is used. This is discussed in more detail in
Cracking Model for Concrete
and
A cracking model for concrete and other brittle materials.
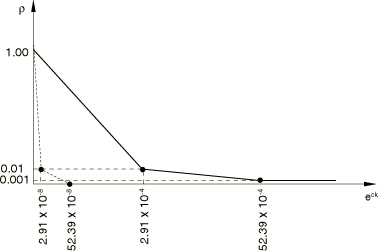
The shear retention properties used for the two meshes are shown in
Figure 4.
The evolution of the shear retention factor, ,
is chosen such that the shear resistance of the material is reduced drastically
as soon as the crack initiates.
The response of the load transmitted at point B or D versus the crack mouth
sliding displacement (CMSD) of the notched
beam obtained with the two meshes is shown in
Figure 5.
This figure shows that the coarse and fine meshes give similar results. Based
on this observation, all subsequent studies are performed using only the fine
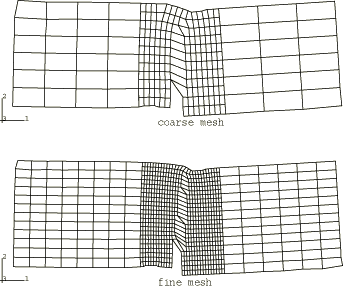
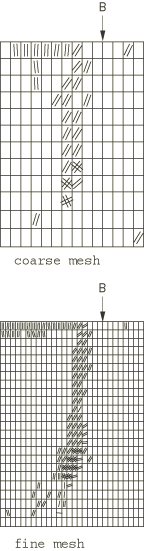
mesh. Displaced shapes and crack patterns obtained at the end of the analysis
are shown for the two meshes in
Figure 6
and
Figure 7.
The crack propagation path tends to curve away from the original crack tip and
move toward point B. This behavior is typical for a crack subjected to
mixed-mode loading.
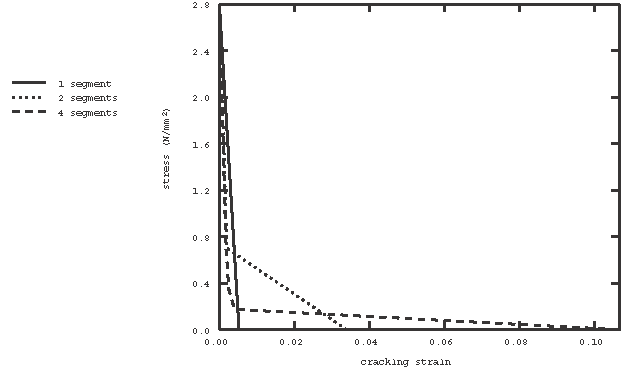
Influence of tension softening
The previous results were obtained using linear tension softening. The
maximum load-carrying capacity of the beam compares well with the experimental
observations of Arrea and Ingraffea. However, the postcracking behavior is
somewhat stiff compared to the experiments. In the following study we use three
different evolutions of the stress as a function of cracking strain. We compare
the linear variation used previously to two tension softening functions where
the stress is reduced more rapidly as the crack initiates. These functions are
shown in
Figure 8:
one consists of a two-segment representation of softening, and the other is a
four-segment representation. The area under the softening curve is the same in
all cases so that the value of the Mode I fracture energy of the material is
preserved.
The load-CMSD responses obtained for the
three tension softening representations are shown in
Figure 9.
Although the analyses were performed over the same duration (0.38 seconds), the
end value of the crack mouth sliding displacement increases as tension
softening is lowered. This is to be expected, since the crack faces are likely
to slide more with respect to each other as tension softening is lowered. The
peculiar behavior observed at a CMSD value of
about 0.15 mm in the case of the four-segment tension softening simply shows
that the response is no longer quasi-static because the crack has propagated
completely through the depth of the beam. It is clear that more rapid
reductions of the stress after initial cracking lead to less stiff responses.
Although the simulation predicts the trend of the experimental results, the
decrease in the simulated load-carrying capacity in the softening region is not
as great as the experimental results suggest. The effect of shear retention is,
therefore, addressed next in an attempt to bring the numerical results closer
to the experimental observations.
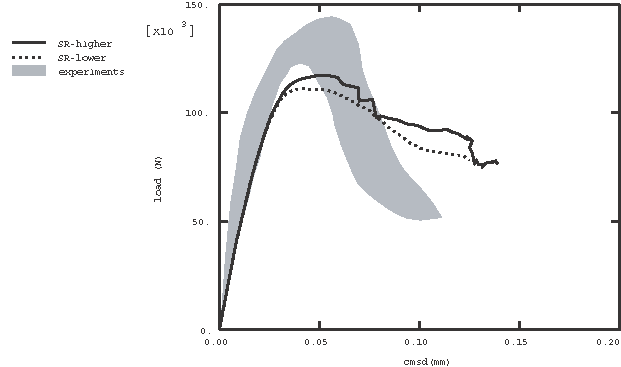
Influence of shear retention
Two different evolutions of shear retention are used to show the influence
of shear retention on the load-CMSD response
of the beam. One is the evolution of shear retention that was used in all
previous analyses. The other is a lower shear retention model, as shown in
Figure 10.
This lower shear retention model corresponds to practically no shear carrying
capability in the cracked elements once cracking initiates.
The load-CMSD responses obtained for these
two cases are shown in
Figure 11
for the fine mesh with the two-segment tension softening model and in
Figure 12
for the fine mesh with the four-segment tension softening model. Although we
still apply the same linearly varying velocity at point C (0.75 mm/second at
0.38 seconds), the analyses for the lower shear retention model were stopped at
0.36 seconds and 0.34 seconds for the mesh with the two- and four-segment
tension softening models, respectively. These times roughly correspond to times
at which the crack has propagated across the entire depth of the beam.
Responses obtained after these times are no longer meaningful in the context of
this problem, since the beam no longer has any static load-carrying capacity,
and the applied velocity loading causes the beam to respond dynamically.
The results show that, even using zero shear retention, the numerical
simulation is not able to predict both a peak load of about 140 kN and the
sharp reduction of that load observed in the experiments. This can be explained
by the bias introduced when using a rectangular mesh, which tends to promote
crack propagation along vertical lines of elements instead of the more curved
crack path observed in the experiments. Rots et al. (1989) have indeed shown
numerical results that match the softening response of the beam better by using
a mesh designed with elements aligned along the experimentally observed curved
crack path. This can be done in a case such as this one where good experimental
data exist, but it is not possible in general. Results obtained for plain
concrete should, therefore, be treated as only relatively coarse approximations
of actual behavior.
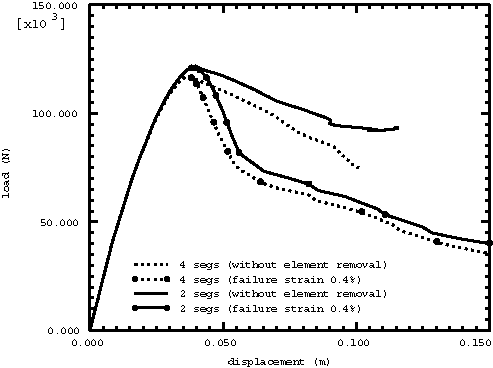
Effect of element removal
Abaqus/Explicit
provides a brittle failure criterion that allows elements to be removed when
any local direct cracking strain (or displacement) reaches a failure strain (or
displacement). This option is intended primarily to avoid analyses that end
prematurely because cracked elements undergo too severe distortion. However, as
discussed later, by setting the failure strain for element removal to a
relatively low value, the removal of cracked elements can also create a
significantly weaker postfailure behavior.
Figure 13
and
Figure 14
show the effect of element removal. In
Figure 13
the two- and four-segment tension softening curves of
Figure 8
are used, respectively, and the failure strain is chosen as 0.4%. The
load-CMSD responses obtained for these two
simulations are plotted compared to the corresponding responses without element
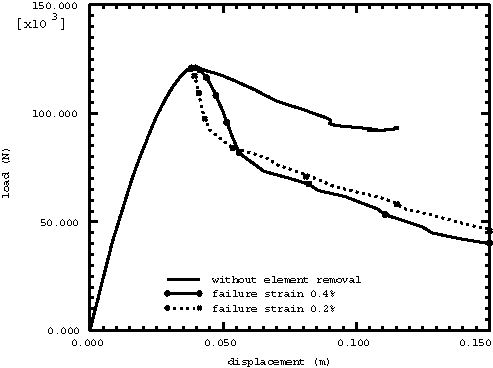
removal. In
Figure 14
the two-segment tension softening curve is used. Two levels of failure
strain—i.e., 0.2% and 0.4%, respectively—are considered. The resulting
load-CMSD responses are plotted along with the
corresponding responses without element removal. As expected, the use of this
brittle failure model produces a large drop in the load after the peak load is
reached.
Input data used to obtain the fine mesh, 0.2% failure strain, and the
two-segment tension softening response shown in
Figure 14.
References
Arrea, M., and A. R. Ingraffea, “Mixed-Mode
Crack Propagation in Mortar and
Concrete,” Report No. 81–13, Dept. of
Structural Engineering, Cornell University, Ithaca,
N.Y., 1982.
de Borst, R.,
Ph.D. thesis, Delft University of
Technology, The Netherlands, 1986.
de
Borst, R., “Computation
of Post-Bifurcation and Post-Failure Behavior of Strain-Softening
Solids,” Computers and
Structures, vol. 25, no. 2, pp. 211–224, 1987.
Meyer, R., H. Ahrens, and H. Duddeck, “Material
Model for Concrete in Cracked and Uncracked
States,” Journal of Engineering Mechanics
Division, ASCE, vol. 120,
EM9, pp. 1877–1895, 1994.
Rots, J.G., “Removal
of Finite Elements in Smeared Crack
Analysis,” Proceeding of the Third Conference
on Computational Plasticity, Fundamentals and Applications, Part I, Pineridge
Press, Swansea, United
Kingdom, pp. 669–680, 1992.
Rots, J.G., “Smeared
and Discrete Representations of Localized
Fracture,” International Journal of
Fracture, vol. 51, pp. 45–59, 1991.
Rots, J.G., and J. Blaauwendraad, “Crack
Models for Concrete: Discrete or Smeared? Fixed, Multi-Directional or
Rotating?,” HERON, Delft University of
Technology, The
Netherlands, vol. 34, no. 1, 1989.
Rots, J.G., and R. de
Borst, “Analysis
of Mixed-Mode Fracture in Concrete,” ASCE
Journal of Engineering Mechanic, vol. 113,
EM11, pp. 1739–1758, 1987.
Rots, J.G., G. M. A. Kusters, and J. Blaauwendraad, “The
Need for Fracture Mechanics Options in Finite Element Models for Concrete
Structures,” Computer-Aided Analysis and
Design of Concrete Structures, Pineridge Press, Swansea, United
Kingdom, pp. 19–32, 1984.
Rots, J.G., P. Nauta, G. M. A. Kusters, and J. Blaauwendraad, “Smeared
Crack Approach and Fracture Localization in
Concrete,” HERON, Delft University of
Technology, The
Netherlands, vol. 30, no. 1, 1985.
Tables
Table 1. Concrete material properties.
Young's modulus:
24800 N/mm2 (3.60 ×
106 lb/in2)
Poisson's ratio:
0.18
Cracking failure stress:
2.8 N/mm2 (406.09
lb/in2)
Mode I fracture energy
:
0.055 N/mm (0.314 lb/in)
Density:
2.4 × 10⁻⁶ kg/mm3
(0.225 × 10⁻³ lb s2/in4)
Figures
Figure 1. Notched, mixed-mode beam: geometry and dimensions. Figure 2. Finite element meshes used for notched, mixed-mode concrete
beam. Figure 3. Tension softening model used for mesh refinement study. Figure 4. Shear retention model used for mesh refinement study. Figure 5. Mesh refinement study: load-CMSD
responses. Figure 6. Displaced shapes obtained in mesh refinement study (magnification
factor 200). Figure 7. Crack patterns obtained in mesh refinement study (detail of the
concrete beam around its notch). Figure 8. Tension softening models. Figure 9. Tension softening study; fine mesh. Figure 10. Shear retention models. Figure 11. Shear retention study; fine mesh with two-segment tension
softening. Figure 12. Shear retention study; fine mesh with four-segment tension
softening. Figure 13. Element removal: tension softening study for plane stress fine
mesh. Figure 14. Element removal: plane stress fine mesh with a two-segment tension
softening curve.