Notched unreinforced concrete beam under 3-point
bending
This example illustrates the use of the concrete damaged
plasticity model in both
Abaqus/Standard
and
Abaqus/Explicit
for the analysis of an unreinforced notched concrete beam under 3-point
bending.
This problem is chosen because it has
been studied extensively both experimentally by Petersson (1981) and
analytically by Rots et al. (1984, 1985), de Borst (1986), and Meyer et al.
(1994), among others. The predominant behavior is Mode I cracking, so the
example provides good verification of this aspect of the constitutive model. We
also have the advantage that this beam experiment has been repeated by a number
of different researchers, and there is good material information about
important parameters, such as the Mode I fracture energy,
.
Thus, we can directly compare the numerical results with the experimental
results with minimal uncertainty. We also investigate the sensitivity of the
numerical results to the finite element discretization and to the choice of
cracking material properties.
Abaqus
provides constitutive models suitable for brittle materials such as concrete in
which cracking is important. These models are intended for unreinforced as well
as reinforced concrete structures.
The concrete damaged plasticity model in
Abaqus
provides a general capability for modeling plain or reinforced concrete in the
applications of monotonic, cyclic, and/or dynamic loading. This model can be
used to simulate the irreversible damage involved in the fracturing process and
the recovery of stiffness as loads change from tension to compression or vice
versa. In addition, this model can include strain rate dependency. For more
details on this model, see
Concrete Damaged Plasticity.
In addition to the concrete damaged plasticity model,
Abaqus
provides the smeared cracking concrete model in
Abaqus/Standard
and the brittle cracking model in
Abaqus/Explicit.
For a description of these models, see
Concrete Smeared Cracking
and
Cracking Model for Concrete.
Problem description
The notched beam is shown in
Figure 1.
Because of symmetry, only one half of the beam is modeled.
Figure 2
shows the three meshes used for this problem: a coarse mesh of 70 elements, a
medium mesh of 280 elements, and a fine mesh of 1120 elements. We model the
beam using plane stress (CPS4R) elements and three-dimensional (C3D8R) elements to provide verification of both element types.
The beam has a Young's modulus of 30 GPa (4.35 × 10⁶
lb/in2), a Poisson's ratio of 0.20, a density of 2400
kg/m3 (0.225 × 10⁻³ lb s2/in4), a
cracking failure stress of 3.33 MPa (482.96 lb/in2), and a Mode I
fracture energy
of 124 N/m (0.708 lb/in). The fracture energy value, ,
defines the area under the postcracking stress-displacement curve. The effect
of different postcracking softening behavior is the subject of one of the
studies carried out in this example.
Loading
The beam is loaded by prescribing the vertical displacement at the center of
the beam until it reaches a value of 0.0015 m.
Solution control
The Riks method is used in
Abaqus/Standard
since the behavior of the beam is quite unstable when cracking progresses.
Abaqus/Explicit
is a dynamic analysis program. In this case we are interested in static
solutions; hence, care must be taken that the beam is loaded slowly enough to
eliminate significant inertia effects. For problems involving brittle failure,
this is especially important since the sudden drops in load-carrying capacity
that normally accompany brittle behavior generally lead to increases in the
kinetic energy content of the response. Therefore, the beam is loaded by
applying a velocity that increases linearly from 0 to 0.06 m/s over a period of
0.05 seconds to obtain the final displacement of 0.0015 m at the center of the
beam. This ensures a quasi-static solution (the kinetic energy in the beam is
small throughout the response) in a reasonable number of time increments.
Nevertheless, oscillations in the load-displacement response caused by inertia
effects are still visible, mainly after the concrete has cracked significantly.
The speed of application of the loading in
Abaqus/Explicit
is the subject of another study in this problem.
Results and discussion
Results are described below for each analysis variation.
Mesh refinement study
The three finite element meshes described earlier are used to show the
influence of mesh refinement on the load-displacement response of the concrete
beam.
Since there is no reinforcement in this problem, the postfailure behavior
is specified in terms of the stress-displacement response to minimize mesh
sensitivity. We can also specify the postfailure behavior directly in terms of
the fracture energy, .
The fracture energy method assumes a linear loss of strength after cracking.
Thus, if we specify the tension softening behavior in terms of stress versus
cracking displacement and assume a linear curve (,
0), (0, /)
as shown in
Figure 3,
the above two methods will give the same results. Tensile damage is specified
in terms of the tension damage variable, ,
versus the cracking displacement. A linear dependence—(0, 0), (0.9,
)—is
assumed for this study, as shown in
Figure 4.
For the constitutive calculations,
Abaqus
automatically converts the cracking displacement values to “plastic”
displacement values using the relationship
where the specimen length, ,
is assumed to be one unit; (i.e., ).
Care must be taken in specifying the tension damage to ensure that the
calculated plastic strain (or displacement) is positive and monotonically
increasing with increasing cracking strain (or displacement).
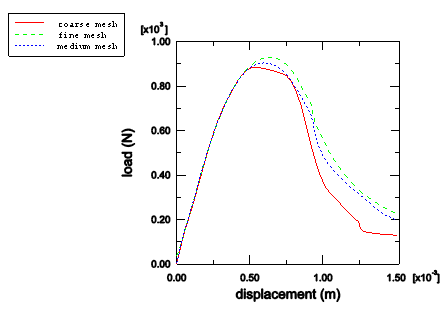
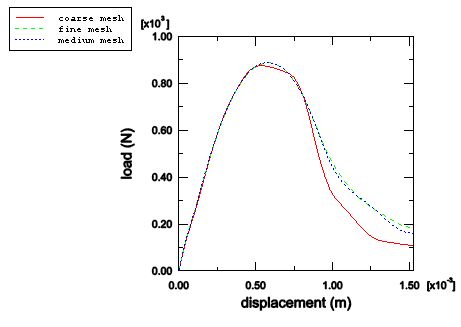
The load-displacement response of the notched beam obtained for the three
meshes with
Abaqus/Standard
is shown in
Figure 5
for the three-dimensional models and in
Figure 6
for the plane stress models. The load-displacement response obtained with
Abaqus/Explicit
is shown in
Figure 7
for the three-dimensional models and in
Figure 8
for the plane stress models. These figures show that the three-dimensional and
plane stress models in
Abaqus/Standard
are in close agreement. Minor differences are observed in the results obtained
with
Abaqus/Explicit;
these can be attributed primarily to dynamic effects. Three-dimensional models
have a relatively higher level of mesh sensitivity due to the effect of
possible cracking in the out-of-plane direction. For the two-dimensional
models, although a small amount of mesh sensitivity remains between the coarse
mesh and the other two meshes, the medium and fine meshes give similar results.
Based on these observations, all subsequent studies are done using the plane
stress medium mesh. All the curves shown are smoothed. Displaced shapes
obtained with
Abaqus/Standard
for the three plane stress meshes are shown in
Figure 9.
The three-dimensional meshes and the
Abaqus/Explicit
meshes show essentially the same deformation. The expected Mode I fracture
pattern is observed consistently in all meshes.
Influence of tension softening
The results described above are obtained using linear tension softening.
Such a choice of softening leads to a response that is too stiff compared with
the experimental observations of Petersson. In this study we use three
different evolutions of the stress as a function of the cracking displacement.
We compare the linear variation used previously to two tension softening
functions where the cracking stress is reduced more rapidly as the crack
initiates. These functions are shown in
Figure 10:
one consists of a two-segment representation of softening, and the other is a
four-segment representation. The area under the softening curve is the same in
all cases so that the value of the Mode I fracture energy of the material is
preserved. Different linear tension damage curves are used for each tension
softening model in this study to ensure that the plastic displacement is
positive and monotonically increasing with increasing cracking displacement for
all three tension softening curves.
The load-displacement responses obtained with
Abaqus/Standard
for the three tension softening representations are shown in
Figure 11
for the plane stress medium mesh. For
Abaqus/Explicit
the responses are shown in
Figure 12
for the plane stress medium mesh. It is clear that more rapid reductions of the
cracking stress after initial cracking lead to less stiff responses. The
modeling of tension softening is a key determinant of the peak/failure
response. The two-segment and four-segment softening models provide
peak/failure responses that agree well with the experimental observations of
Petersson. The initial linear responses of the calculated results are slightly
softer than the experimental results. This small difference is because a
relatively blunt notch is used in this study, while a much sharper cast notch
was used in Petersson (1981). All the curves shown have been smoothed.
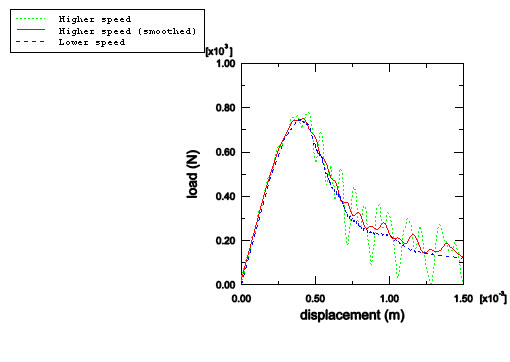
Influence of speed of application of the load and curve smoothing in
Abaqus/Explicit
The quasi-static solutions obtained in the previous
Abaqus/Explicit
studies still show some oscillations due to inertia effects, albeit somewhat
hidden by the fact that curve smoothing is used. This additional exercise is
intended to show the difference between the unsmoothed and smoothed responses
obtained at the loading speed used thus far (0.06 m/s) and an analysis where
the loading is applied at a much lower speed (0.005 m/s).
Figure 13
shows the results obtained for the plane stress medium mesh with four-segment
tension softening. Smoothing of the faster load-displacement response (19635
analysis increments) is shown to match reasonably well the load-displacement
response obtained at the slower speed (235830 analysis increments). Since the
slower response does not provide much more useful information, we conclude that
we are justified to run at the faster speed and to use smoothing to present the
quasi-static response.
de Borst,
R., Ph. D. thesis, Delft University of
Technology, The Netherlands, 1986.
Meyer, R., H. Ahrens, and H. Duddeck, “Material
Model for Concrete in Cracked and Uncracked
States,” Journal of Engineering Mechanics
Division, ASCE, vol. 120,
EM9, pp. 1877–1895, 1994.
Petersson, P.E., “Crack
Growth and Development of Fracture Zones in Plain Concrete and Similar
Materials,” Report No. TVBM-1006, Division of
Building Materials, University of Lund,
Sweden, 1981.
Rots, J.G., G. M. A. Kusters, and J. Blaauwendraad, “The
Need for Fracture Mechanics Options in Finite Element Models for Concrete
Structures,” Computer-Aided Analysis and
Design of Concrete Structures, Pineridge Press, Swansea, United
Kingdom, pp. 19–32, 1984.
Rots, J.G., P. Nauta, G. M. A. Kusters, and J. Blaauwendraad, “Smeared
Crack Approach and Fracture Localization in
Concrete,” HERON, Delft University of
Technology, The
Netherlands, vol. 30, no. 1, 1985.
Figures
Figure 1. Notched beam: geometry and dimensions. Figure 2. Finite element meshes of half of the notched beam. Figure 3. Tension softening model used for mesh refinement study. Figure 4. Tension damage curve used for mesh refinement study. Figure 5. Three-dimensional
Abaqus/Standard
mesh refinement study. Figure 6. Plane stress
Abaqus/Standard
mesh refinement study. Figure 7. Three-dimensional
Abaqus/Explicit
mesh refinement study. Figure 8. Plane stress
Abaqus/Explicit
mesh refinement study. Figure 9. Displaced shapes obtained in the plane stress
Abaqus/Standard
mesh refinement study (magnification factor 100). Figure 10. Tension softening models. Figure 11. Abaqus/Standard
tension softening study: plane stress medium mesh. Figure 12. Abaqus/Explicit
tension softening study: plane stress medium mesh. Figure 13. Abaqus/Explicit
speed and curve smoothing study: plane stress medium mesh.