Design Comparison | ||||||||
|
| |||||||
The Compare page provides an overview of the data points in the basket and allows you to confirm that you placed the appropriate alternatives in the basket. You use tools on the Compare page to help you compare different data points and decide if you want to keep a selected alternative in the basket and/or if you want to add additional designs to the basket. You can also use the Compare page to recommend an alternative in the basket.
Icon View
The Icon View displays images in the data set, including .3DXML files that can be viewed with a 3DXML viewer. For example, the following figure shows the Icon View with two alternatives for an aircraft design in the basket: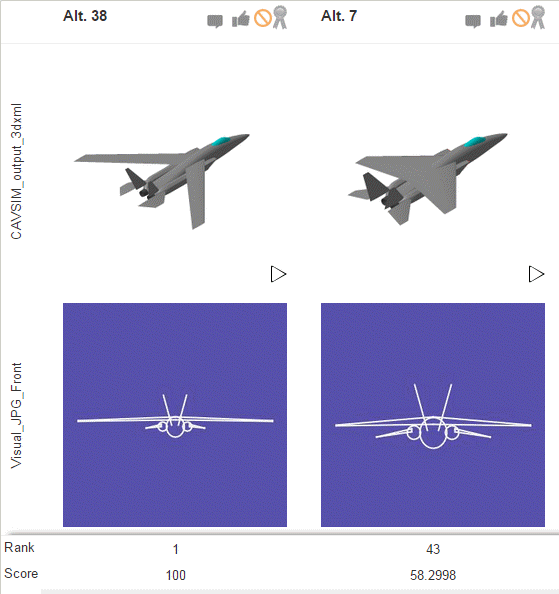
You can add a file as a parameter to an alternative by dragging the file (say, from Windows Explorer or from your desktop) to the header row of the Icon View. For example, you might have a report from the marketing department that you want to store with an alternative in the basket. The same file appears in the Files tab of the More Info page for the selected alternative on the Explore page.
The icon view also shows any array plots that you created with the More Info page, as described in More Information. For example, the following figure shows an array plot of stress versus array index for three alternatives:
Table View
The Table View displays:
- The value of the parameters—both parameters that were defined as objectives and parameters without associated objectives.
- An image that was stored as a file parameter. Results Analytics first tries to display a thumbnail image associated with a 3DXML file. If a thumbnail image is not found, displays the first image (.jpg, gif, or .png file) it encounters in the data set.
The data points are sorted by rank, with the highest ranked data point displayed in the leftmost column. For example, the following figure shows the Table View with the same two alternatives for an aircraft design in the basket: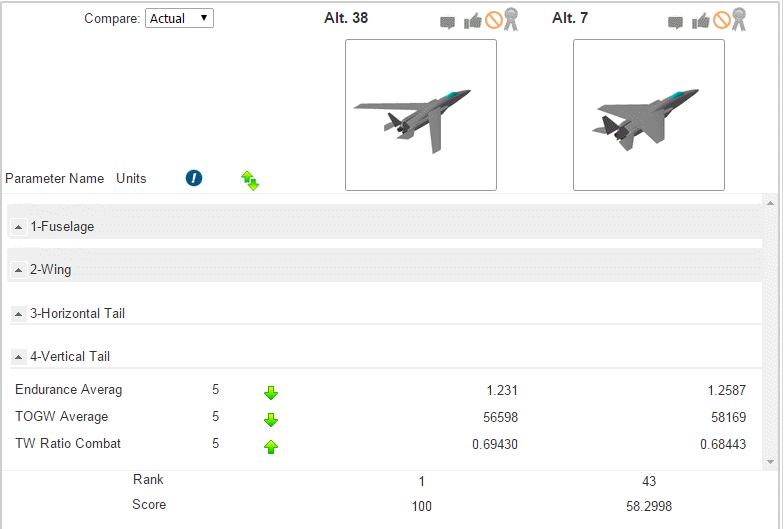
Objective Comparison
The Objective Comparison view provides a graphical overview of the relative value of the parameters defined as objectives.
The outermost points in the Objective Comparison view are always the best points for meeting the objective. If the objective is to maximize the parameter, the data point with the largest value of the parameter is plotted on the outside. Conversely, if the objective is to minimize the parameter, the data point with the smallest value of the parameter is plotted on the outside. The scale of the axes for each parameter is arbitrary: the data point that is the best match for the objective is plotted near the outer edge; the data point that is the worst match for the objective is plotted near the center; intermediate data points are scaled between the extrema accordingly.
For example, the following figure shows the Objective Comparison view for the Tesla Model S (the blue line) and the Toyota Prius (the orange line) from the car shopping data set. The Tesla has the highest Highway MPG and the biggest Cargo Capacity; the Toyota has the lowest Average Cost Per Mile.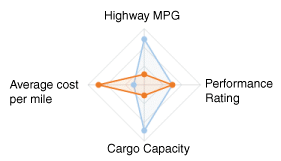
If a parameter group contains one of more parameters that were defined as objectives, Results Analytics creates a score for the group, and the Objective Comparison view shows the score for the group for each data point. You can click on the group name in the Objective Comparison view to expand the group and to see a comparison of the parameters in the group (the parameters that you defined as objectives).
Alternatives
By default, the Objective Comparison view displays all of the data points that you placed in the basket. You can remove a data point from the Objective Comparison view by toggling it off in the list of Alternatives list.
Files
By default, the Compare page shows a visual representation of all the parameters that refer to files, such as .png files showing different views of an alternative. You can remove an image from the Compare view by toggling it off in the Files list.
Parameter View
By default, the table view of the Compare page shows a list of only the parameters that were defined as objectives. Alternatively, you can use the Parameter View list to see only the parameters that were defined as thresholds, or you can choose to see all of the parameters.
Compare
By default, the Compare page shows only the data points that you placed in the basket. Alternatively, you use the Compare menu to see:
- Best Per Objective
- For each objective, display the data point that best meets each objective. The data point does not have to be in the basket and could be infeasible. However, you cannot recommend an alternative that is not in the basket.
- Best By Score
- Show the five data points with the highest scores. The data point does not have to be in the basket and could be infeasible. However, you cannot recommend an alternative that is not in the basket.
Ranking Method
You can use the Ranking Method menu to see the effect of changing ranking methods on the score and rank of the designs in the basket.