-
From the left panel, select
 6W Vocabulary.
-
Click
 Add
Vocabulary. Add
Vocabulary.
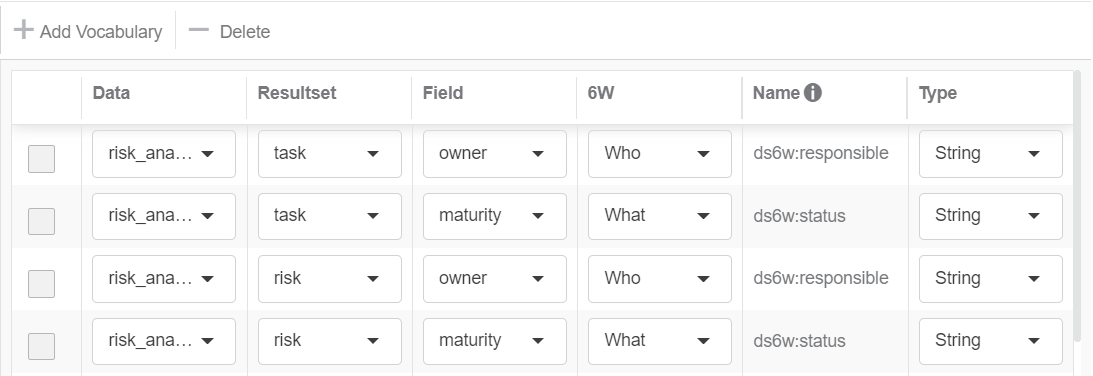
A new row displays in the table to let you define the 6W vocabulary
resource.
-
Define the 6W vocabulary resource.
-
For Data, select a Data Query.
-
For ResultSet, select a Data Query ResultSet.
-
For Field, select the field you want to map to the 6W
Tag.
-
For 6W, select the 6WTags category to associate with the vocabulary resource (Who, What, Where,
etc.)
-
For Name, enter the tag label.
Recommendation:
Prefix your label with the ds6w:
namespace, so that 6WTags can understand it and display it with other widget tags.
-
For Type, select the type of values displayed by the
vocabulary resource, that is Integer,
String, or Date. In 6WTags, the display of values varies depending on the selected type. The default type
is String.
- Optional:
Add other vocabulary resources.

-
Create a filter variable and bind it to the data query.
-
From the left panel, select
 Variable.
-
Add a variable, and for Type, select
Filter.
-
Go to the Binding tab.
-
From the top list, select a data query previously configured.
-
Under Refinement, select the filter variable that you want
to apply to refine data.
For more information, see Bind a Variable.
-
Use the filter variable in your screen visualizations. For example, use the variable
for the on-click effect of a chart.
-
From the left panel, under
 Presentation, select a screen.
-
Select a visualization, and from the Properties panel, click
 Actions.
-
Click
 to add an
effect. to add an
effect.
-
For Behavior, select filter.
-
For Target studio variable, select the filter variable you
created in step 2.
When the user clicks a 6W Tag, the visualization
filters out data accordingly.
|