User Interface | |||||
|
| ||||
|
|
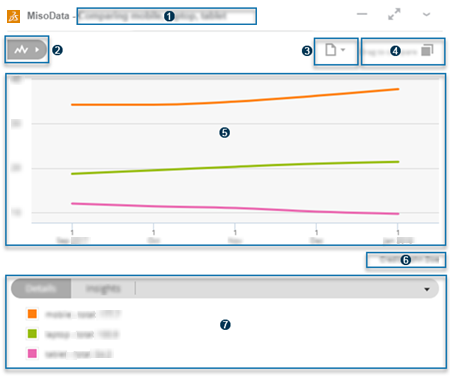
Title Displays the chart title. See Edit the Chart Title. |
|
|
Chart Type or MisoData Status Displays a command that allows you to change the chart type or see crawl logs. |
|
|
Export and Publish to 3DSwym Displays commands that allow you to export the chart data, download a screenshot of the chart, or publish a screenshot of the chart on 3DSwym. See: |
|
|
Drag to Compare Displays a command that you can click and drag to another configured Metrics Reader, MisoData, or Social Analytics widget that is pinned to the current tab. See Dragging to Compare. |
|
|
Chart or Log Area Displays the chart or crawl logs. You can:
If the chart displays time-series, you can also:
|
|
|
Credits Area Displays the name to whom the data belongs. You can click the name to open its associated source URL, if any. Note:
You may need to expand or maximize the widget to
see the credits area.
See 4 - Customize. |
|
|
Details and Insights Tabs Display the chart legend and specific information about each series. You can click series to edit them. See: |


