Review a Study
You can review the overall status of all combinations of time points and conditions in a map.
-
Select the Monitoring tab of the study.
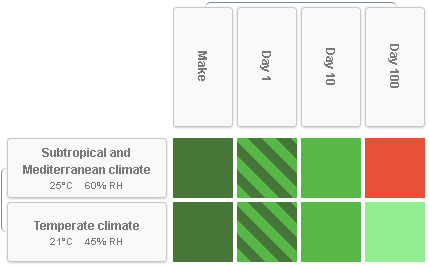
This displays a heat map of all storage conditions and time points for the first material in the study, along with its required, and available amounts. The colors of the cells indicate the statuses of the tasks for each combination.
-
Edit the display of the rows and columns for the map:
- Click to activate editing of the map elements.
-
For any time point or storage condition element, click
 to view the options.
- Optional: Select Hide, to remove the row or column for the current element.
- Optional: Select Show, to redisplay a hidden row or column.
- Click to exit editing of the map elements.
The colors of the intersections between the storage conditions and time points indicate the current status of the tasks for that combination. When all intersections are dark green (that is, all tasks are released) the study is considered completed.