-
Select a scenario in the tree.
-
From the Scenario section of the action bar, click Edit Probes and
Excitations
 .
.
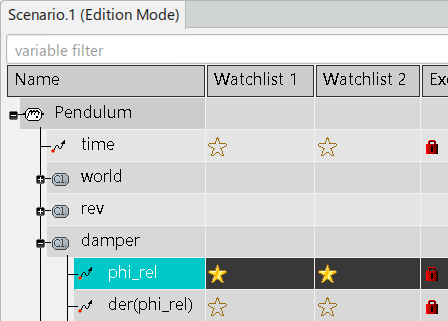
The Scenario window appears and displays the model
structure, from the function or logical component to the dynamic behavior.
-
To create a new watchlist with or without a live plot, expand a behavior and
right-click an input or an output, and then select:
- To create a watchlist without the live plot option, select Add to a new
watchlist
 .
.
- To create a watchlist with the live plot option, select Add to a new
watchlist (with activated live plot)
 .
.
- The variable is automatically added to a new Watchlist
category of the Scenario window.
In this example, both commands
are given to add damper.phi_rel to both a new watchlist
without and with the live plot option:
Note:
You cannot see from the header if the live plot option of the
watchlist is activated, you must look in the tree.
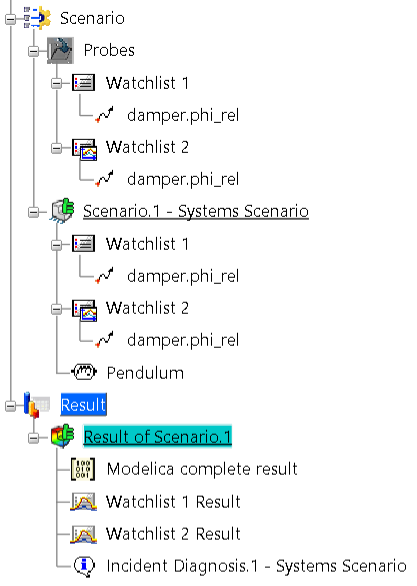
- In the tree, a Watchlist with and
without the live plot option appears in the following locations:

-
To activate or clear the live plot option of a watchlist, in the tree, right-click the watchlist and then click
Activate Live Plot.
The live plot option of the watchlist is activated or cleared.
-
To add a new variable to an existing watchlist, click the corresponding star in the
watchlist column.
The new variable is added to the watchlist column and the star is filled. The
variable is also added to the watchlist nodes in the tree.
-
To remove a variable from a watchlist, click the corresponding star.
The variable is removed from the watchlist and the star is empty. You can then
click the star again to restore the variable.
The variable is also removed from the
watchlist nodes in the tree.
-
To remove a watchlist, right-click the watchlist in the tree and select Delete.
Note:
For a shared watchlist, you can work with the icon in the
Scenario category or the icon in the Probes
category, they are the same.
After the next computation, the corresponding watchlist nodes are created under the
Result category to display the result:
Note:
The icon of the watchlist result is the same for a watchlist with the live plot option as a
watchlist without the live plot option.