Display a Minimized Variable Browser
You can minimize each Variable Browser, if undocked. If
minimized, it is represented by an icon  on the right
side of the screen. on the right
side of the screen. Note:
You have several identical icons, but the tooltip display the
simulated item and the time.
To display the minimized Variable Browser, click the
wanted Variable Browser
icon to the right on your screen.
The selected Variable Browser appears.
Hide and Display Columns
You can hide and display columns in the
Variable Browser.
-
Right-click any of the column headers and select Open Column
Manager
 . .
The Column Manager displays
all available columns and what columns are currently displayed.
-
To manage the display of columns, do any of the following:
- To display a selection of columns, select the columns by pressing
Ctrl and select the column names, and then
click Show Selection.
- To hide a selection of columns, select the columns like above, and
then click Hide Selection.
- To display all columns, click Show
All.
- To hide all columns, click Hide All.
It is also possible to select what columns to display
without using the Column Manager. You can instead
right-click any column header and select from the following:
- Hide Column: Hides the column you
selected.
- Show All Columns: Displays all columns.
- : Select Value (or another
item) to display the item column.
Note:
Show Column is only visible when a column is
hidden.
The display of the columns is updated according
to your selection.
View the Children of a Node
You can view or hide the children of a node in a
list in the Variable Browser.
-
Click + next to a name.
The first level of children of the node is displayed.
-
Click - next to the name to collapse a node.
The first level of children of the node is hidden.
Sort the Content of the Variable Browser
You can sort the content of the Variable
Browser alphabetically for each column. The sorting can be ascending
or descending.
-
Click the column header.
An arrow appears in the column header. The results are now
sorted in ascending alphabetical order.
-
Click the column header again.
The direction of the arrow reverses. The results are now sorted
in descending alphabetical order.
Filter the Content by Name
You can filter the content of a list in the
Variable Browser by variable name.
Before you begin: This description assumes have you have not applied any name filtering already.
-
To select what column you want the filter to work on, right-click the
header and select Apply Filter on this Column.
The default selection is the Variable Name column.
The result is:
- The column is selected for filtering.
- The contextual command Apply Filter on this
Column is not available for the column header of
this column.
-
In the Filter box, start typing.
The following is the result:
- The filtering is dynamically applied for the selected column, that
is, the content of the Variable Browser is
filtered after each character you type.
- A filter icon
 appears in the header of the selected column.
- Optional:
To use the typed text to filter another column instead, right-click the
header of that column and select Apply Filter on this
Column.
- The filtering text is applied on that column instead.
- The filter icon
is moved to the header of that column.
-
To clear the text filtering, click Clear the text
filter
 after the Filter box. after the Filter box.
The following is the result:
- The name filtering is removed. Any other filtering is still present.
- The filter icon
disappears from the column header.
Filter the Content by Type and Variable Selections
You can filter the content in the
Variable Browser by type and variable selections.
Note:
You can filter on both simultaneously.
-
To display the filtering alternatives for types and variable selections,
expand More Filters.
The filtering alternatives appear, divided in two groups:
- Show: Filtering of types. The group contains:
- Constants
- Time-varying
- Parameters
- Tunable values
- Variable selection: Filtering of variable
selections. The group contains:
- In no predefined filter
Note:
This alternative is complementary
to all the other alternatives, that is, if you clear all
alternatives, the Variable
Browser contains no
variables.
- A list of user-defined variable selections.
For more
information about user-defined variable selections, see
Dymola Behavior Modeling User's Guide:
Performing a Virtual Execution: Managing Variable
Selections.
-
To specify the filtering, apply your choice of selections.
Filter on Selected Component
You can filter the Variable Browser on a node
corresponding to a selected component.
-
To activate this filtering, click, in the Variable
Browser header, Show Preferences
 ,
then activate Automatic Filter Tree. ,
then activate Automatic Filter Tree.
The Variable Browser is displaying only the
node corresponding to the selected component. Notes:
- This option and the option Automatic Center
Tree are exclusive. You cannot activate both at
the same time. However, you can clear both.
- By default, the option Automatic Center Tree is activated, and
the option Automatic Filter Tree is
cleared.
- The options can have different values in each Variable
Browser.
-
From the diagram, or from the Component Browser,
select the component.
Note:
If you select a subcomponent, the whole component is displayed in the
Variable Browser.
The following is the result:
- The Variable Browser is displaying only the
node corresponding to the selected component.
- The filtering field displays the filtering for the selected
component or subcomponent.
Note:
This node is displayed until you select another component, that
is, if you deselect the component by clicking outside it, the
Variable Browser still displays the previously
selected component.
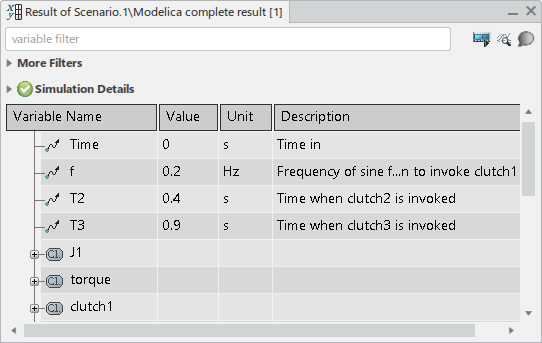
Display Simulation Information
You can display information about the simulation by expanding
Simulation Details.
The simulation information contains:
- Full name of the simulated model
- Status of the simulation (initialized, computing, success, or failed)
- Stop time
- Date and time of simulation
- Solver settings: solver name, tolerance, and fixed step interval ("no" for
step interval means variable steps)
Note:
You can always see the status of the simulation from the icon in front of
the Simulation Details header:
Plot Commands
You can perform a number of plot commands from the Variable
Browser.
For more about the plot commands, see Creating Plots Using the Variable Browser and Modifying Plot Content.
Replay Animation
From the Variable Browser, you can replay the
animation.
For more information, see Replaying an Animation.
Perform Simulation Analysis
From the Variable Browser, you can perform simulation
analysis.
For more information, see Simulation Analysis: Analyzing Numeric Intergration and Events.
Display the Incident Diagnosis
You can display the incident diagnosis
from the Variable Browser.
To display incident
diagnosis, under the header of the Variable Browser,
click Show Simulation Log
 . .
For more information about the incident diagnosis, see Viewing Computation Incidents.
Display a Class in an Immersive Dockable Panel
You can display a class in an immersive dockable panel.
Navigate to the node or signal you want to display in an immersive dockable
panel, right-click it, and select Display Immersive
Diagram.
An immersive dockable panel displaying the enclosing class appears.
Some features of the panel:
- If the class supports animation, the content of the 2D panel is also
animated.
- If the class contains objects that could be interacted with, you can
interact with them when simulating. You can, for example, start a
motor.
- Several immersive dockable panels can be displayed at the same time,
and are animated simultaneously.
Display Modelica Path of Node, and Copy It to Clipboard
You can display the full Modelica path of a node in the Variable
Browser, and copy it to the clipboard.
-
To display the full Modelica path for an item, pause over it.
The path appears in the tooltip.
-
To copy it, right-click it and select Copy Path To
Clipboard.
The path is copied to the clipboard. An example might be
J1.w.
-
To select the corresponding component in the diagram, select the item in
the Variable Browser.
The corresponding component is selected in the diagram. Note:
Only the components
displayed can be selected in the diagram.
Highlight and Reframe on Component Corresponding to Node
You can highlight a diagram component, corresponding to a node in the
Variable Browser, and reframe on it.
-
To highlight a component corresponding to a node in the Variable
Browser, click the node in the Variable
Browser.
The corresponding component is highlighted in the diagram.
-
To reframe on a component in the diagram, corresponding to a node in the
Variable Browser, right-click the node in the
Variable Browser and select Reframe
On.
The diagram is reframed on the component corresponding to the node
in the Variable Browser.
Specifying the Default Variable Browser Panel Docking
You can specify the default Variable Browser panel
docking.
To control the default Variable Browser panel docking,
specify the option Default variable browser docking
from > Systems > Behavior
Modeling, the Results tab, the
Results Management Settings group.
The default is Stacked, that is, a new
Variable Browser is stacked in the same panel
as previous Variable Browsers, as a new tab.
For more information, see Native Apps Preferences
Guide: Results.
Close Variable Browsers
You can manually close any Variable Browser like closing
any other window.
To prevent closing a Variable Browser by mistake, a warning is
displayed before closing the browser. You can disable such warnings in the warning
dialog or by clearing Ask for confirmation before closing any variable
browser from
, the Results tab. For more
information, see Native Apps Preferences
Guide: Results.
|
 :
Simulation success
:
Simulation success :
Simulation failed
:
Simulation failed :
Unknown status.
:
Unknown status.
