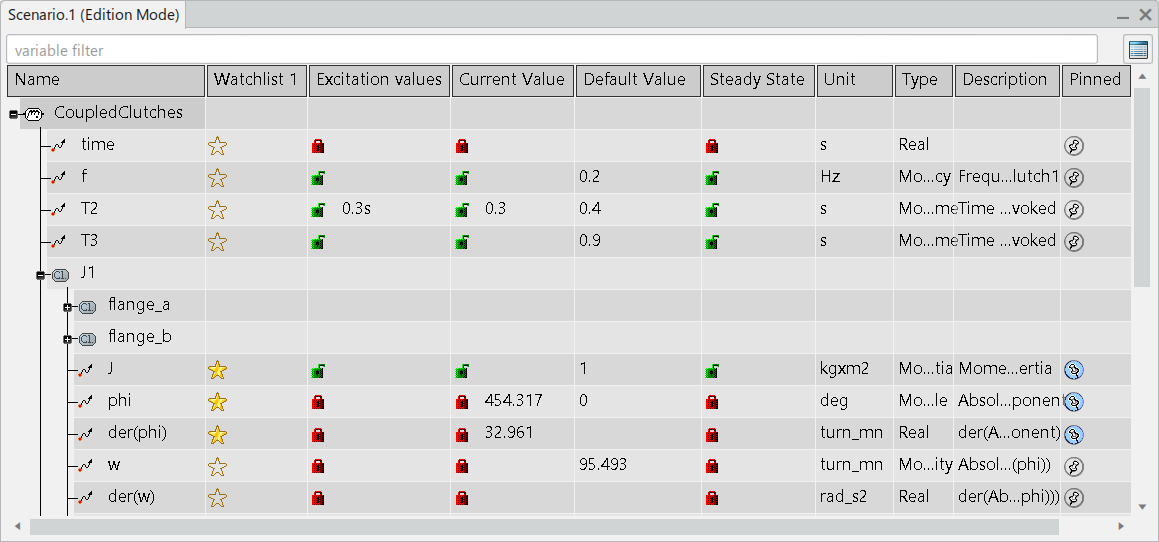
Scenario Window | ||
| ||
Column Content

| Important: If you work with behaviors or models that were created before R2022x FD01 (FP.2205), live plot probes may be present in your scenario. In that case, you have additional Live Plot columns. For more information, see About Watchlist and Live Plot Probes Created Before R2022x FD01 (FP.2205). |
- Columns
-
Column Description and symbols Name Displays the tree structure, the name, and the direction of the port/interface/signal.
Examples of symbols in the tree:
 Modelica class
 Signal
 Output port
 Input port
 Input/Output port
Watchlist [only in Edition Mode, only if any signal present in a watchlist] You can have multiple watchlist columns: Watchlist 1, Watchlist 2 etc.
 Included in the watchlist
 Not included in the watchlist
Excitation Values [only in Edition Mode] Displays the excitation value of ports/interfaces and signals, and if it is locked.  Locked; you cannot edit the value.
 Not locked; you can edit the value.
In this column, you can:
- Define and see initial values. See Defining and Handling Initial Conditions.
- See forced values. See Defining Forced Values.
Current Value [only in Preview Mode] Displays current values. Forced Value [only in Preview Mode] Displays forced values. Default Value [only in Edition Mode] Displays default values. Steady State [only in Edition Mode, only when having imported initial steady state values from the result] Displays initial steady state values. See Creating Steady State Probes. Unit Displays the current knowledge unit of the port/interface or signal. You can change the current unit from , the Units tab. Type Displays the data type. Real, Integer, Boolean, String, Enumeration, and Knowledge magnitude can be displayed. Knowledge magnitude is displayed for Modelica variables if they use units from the Modelica.SIUnits package, for example. Description Displays the description of the port/interface or signal. Pinned Monitors selected variables on the diagram.  Pinned; included in the
monitoring.
 Not pinned; not included in the
monitoring.
Context Menus
- Context Menu of Variables (Only in Edition Mode)
- Variables have a context menu that allows for adding to a new watchlist and to edit time table.
- Context Menu of the Columns
- All columns have commands in the context menus for displaying and hiding columns, and filtering by name. See Working with the Scenario Window.
The following columns have additional commands in the context menu:
Column Additional Items in the Context Menu Watchlist [only in Edition Mode] For filtering on variables in watchlist, and for removing watchlist. Excitation Values [only in Edition Mode] For filtering on variables with forced values, or unlocked variables. Initial Steady State [only in Edition Mode] For removing the column.